Design

EFFIS    Consulting  English  French 

Effective Information & Strategy

Design


A Strategic Analysis Tool ... Powerful and Innovative

  • The Strategic Link to Operations
  • Drill-Down-Anywhere TMAnalysis
  • New Matrix-Business-Analysis TM
  • New Measures of Global to Local discrepancies


4S Manager is an innovative Strategic Decision Support System which allows managers to make effective informed decisions that can directly impact the key success factors in all functions of a company: Finance, Marketing, Sales, Logistics, Manufacturing, Purchasing, R&D, and more. It directly links strategy and operations by providing powerful data interpretation and exploration capabilities that enable corporate convergence between strategic thinking and operational action


Implementing «Matrix Business Analysis™»

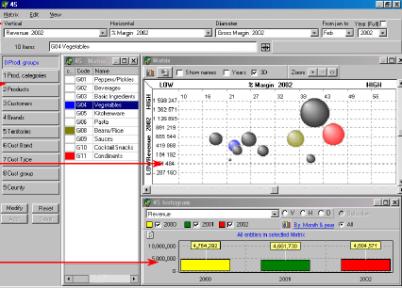
4S Manager is a software tool designed and developed by EFFIS to respond directly to the requirements of the "Matrix Business Analysis™” or MBA approach (see Concepts). In order to always connect strategic, tactical and operational levels, the tool integrates detailed data and aggregates it upward in as many viewpoints as necessary. Thanks to the common detailed database, segments associated with different points of view may always be crossed with others. 4S Manager can also create new segments on the fly, amounting to new viewpoints, and associate them immediately with all existing segments and other viewpoints.

The tool is feature rich and general in scope, combining the flexibility of spreadsheet analysis with the sustainability of predefined management reports.

Providing Strategic Vision

Selected Indicators

From big pictures to details: Drill Down Anywhere™


Matrix and Quadrants


Time Line & Ran Chart


The user interface is easy to grasp yet feature rich. It offers several standard windows that work concurrently, in order to best explore and interpret data

Important aspects of 4S Manager

4S Manager offers a transparent approach to data visualization. Its unique navigation mode is intuitive and easy to master (Drill-Down Anywhere™). Data may be integrated from a spreadsheet program, or from a database with millions of lines. Response times are almost instantaneous, allowing data exploration and simulation in real time. 4S Manager is both powerful and “lightweight”. For example, it can be installed in minutes on a laptop. It can also create custom functions and sophisticated indicators, depending on the specific needs of each enterprise, each business line...

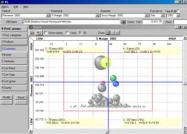
Strong vs. Weak Segments


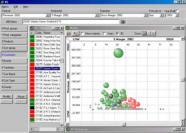
3 Year Evolution on Matrix


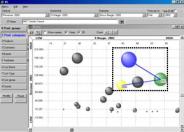
Visual Queries on Subsets


Base Functionalities


Data Set Sizing and Capabilities

  • Up to Millions* of transactional records (feed data lines)
  • Tens (or hundreds*) of Basic Indicators (Revenue, Costs, Units, etc.)
  • Tens (or hundreds*) of Calculated Indicators (% Margin, Growth, etc.)
  • Tens (or hundreds*) of Basic Components (Customers, Products, etc.)
  • Thousands of items per Basic Component (Customers, Products, etc.)
  • Tens (or hundreds*) of Aggregated levels (Families, Categories, etc.)
  • Visualisations of dozens of metrics simultaneously
  • Tens (or hundreds*) of levels of exploration
  • Point and click drill-down and on the fly reordering of all levels of exploration
  • 4S Manager models use available computer memory, in order to provide immediate response time to users. It is therefore possible to build models within the above limits but only selectively, without obviously combining them all. When such limits are taken into account, the response time of 4S Manager is exceptional thanks to an optimized data engine and underlying proprietary algorithms.


Strategic Exploration

  • Drill-Down Anywhere™ capabilities to explore all levels
  • Matrix Business Analysis™ with its SWOT quadrant analysis
  • Visualisation of discrepancies between top and bottom quadrants
  • Visual queries as a starting point for analysis and exploration
  • Automatic coloring of Strengths and Weaknesses by segment
  • Multiple graphs (quadrant bubble charts, bar, line, pie charts)
  • Reports and custom tables explorable at all levels
  • Visual sorts by color, by rank, by value or by attributes
  • A "qualitative" engine to enhance data interpretation
  • Export toward MS Office® for further analysis

Versatility

Multiple Indicators …


Multiple Applications…


Multiple Industries …

% Margin, Expenses, Profits
Actual Rev, Margin, Units
Defects/Returns, Backorders
Financial Ratios, Cash Flow
Growth % Rev, GM, Units
Growth Yr/Yr, Mth/Mth
Inventory Units, Costs
Other: Staff, Market Share
Target Rev, Margin, Units
Turns (Inv, Receivables)
Units (Inventory, Sales)


General management
Finance
Sales
Marketing
Logistics
Manufacturing
Project Management
Purchasing
Human Resources
R&D
Service & Support


Consumer Goods
Distribution/Retail
Energy
Financial Services
Industrial Goods
Insurance
Government
Healthcare
Market Research
Pharmaceuticals
Telecommunications


conseil
.

Copyright 1989-2014 EFFIS